Designing a social media platform for investors
Creating a new product from scratch is an incredibly daunting task. It’s the toughest thing you’ll ever do as a product designer. There are a million reasons why it won’t work, and zero guarantee that it will work, so the whole project is a massive gamble. You just have to buckle up trust that you will figure things out. This project was a labor of love, and my experience as the lead designer was both challenging and rewarding.
[Client]
Tickertape
[Year]
2023
[Role]
Role - Research, UX/UI design, Design Systems
[Catagory]
Technology & Enterprise

Snaps From the Project


A Little about Tickertape
Annual Revenue | MAU | App Downloads | Rating |
|---|---|---|---|
$ 4.86M | 1M+ | 5M+ | 4.3 ★★★★☆ |
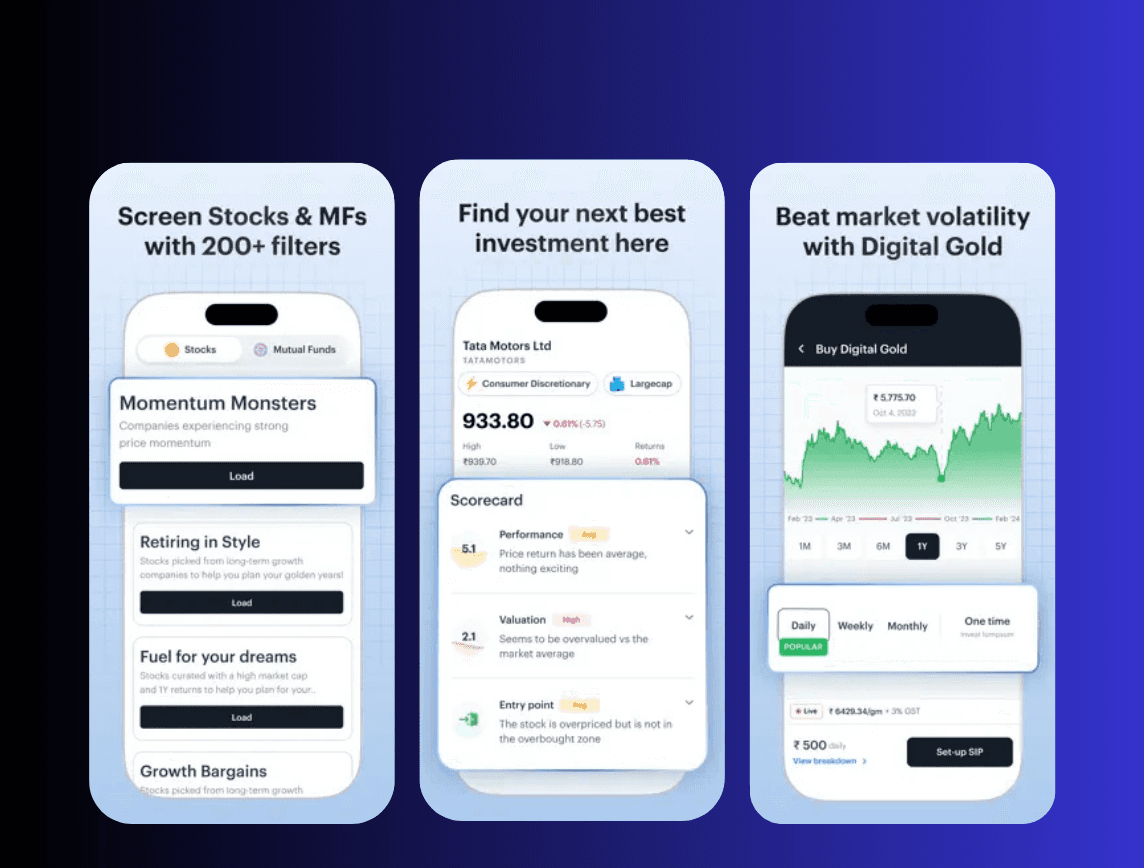
Tickertape is a fast-growing Indian fintech platform focused on making complex financial concepts easy and approachable for Indian investors. It provides tools such as:
Screener to filter assets based on specific criteria
Stock details pages for fundamental analysis
Portfolio features to help users analyze their holdings
Target Users:
Financial Content Creators – Influencers who share insights and analysis
Retail Investors – Everyday investors looking for discussions and expert opinions
The problem
All the above mentioned features were really heavy on analysis and analysis is a niche use case and very few users did that. So Tickertape now wanted to build tools and features that were more accessible for wider part of ppl investing in market. Make it easier for new investors access financial info and get comfortable with investing
Introducing Tickertape Social
Tickertape Social was an experimental project initially conceived by the CEO based on certain hypothesis he had.
I designed Tickertape Social as a community-driven platform within Tickertape that allows investors to connect, share insights, and discuss market trends in a structured, distraction-free environment. Unlike traditional social media, which is filled with unrelated content, Tickertape Social ensures that discussions remain focused on finance, helping both new and experienced investors make more informed decisions. My goal was to transform financial investing from a solo activity into a collaborative experience.
Product Highlights
Asset tagging to make financial discussions more structured and data-driven. Users can tag specific stocks, ETFs, or mutual funds directly within their posts.
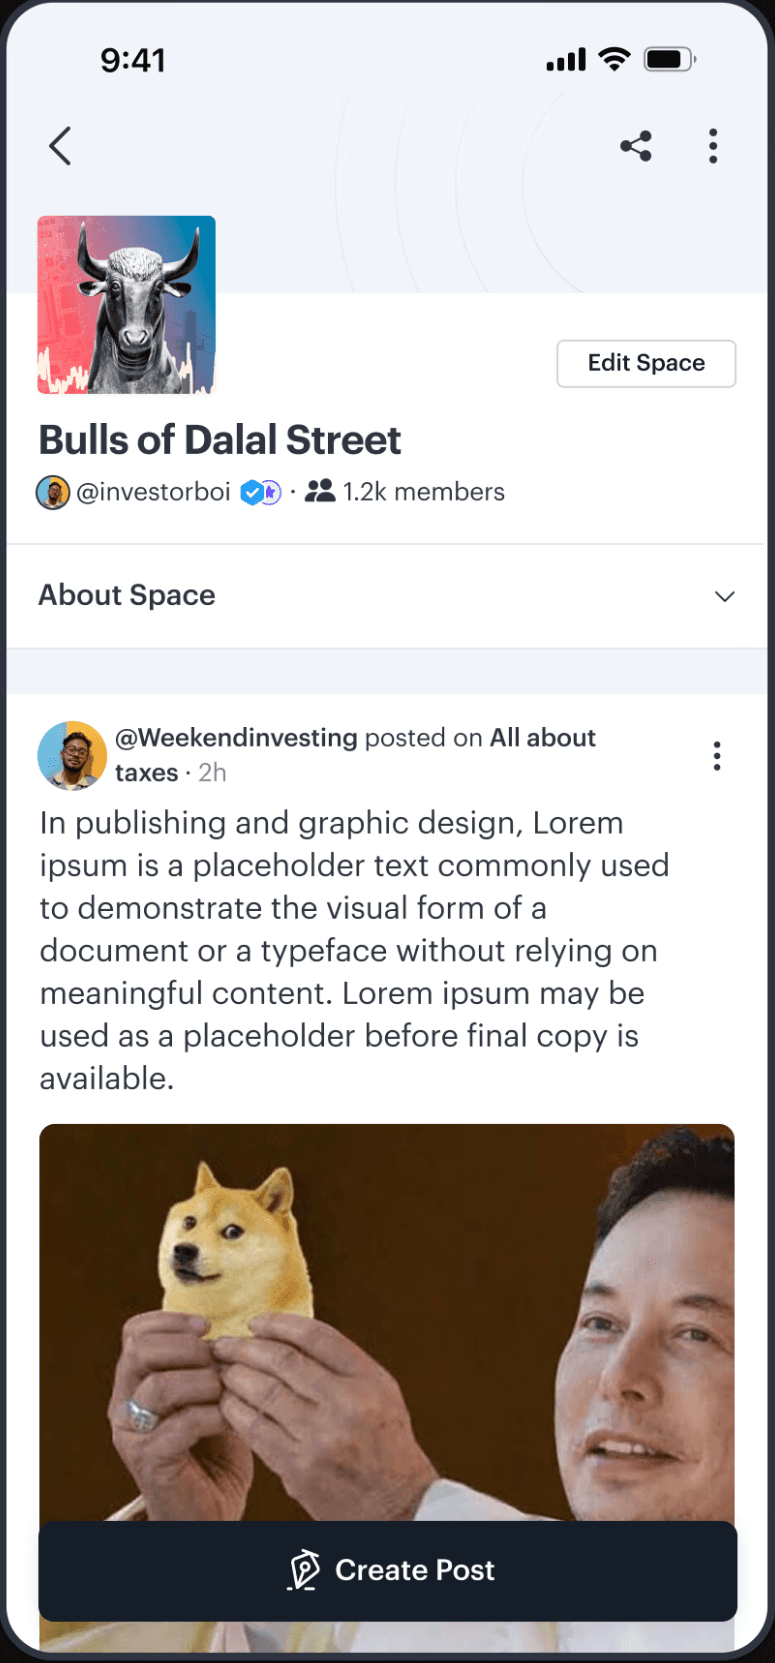
A dedicated area called a "Space" to enable creators and their followers have focussed discussions
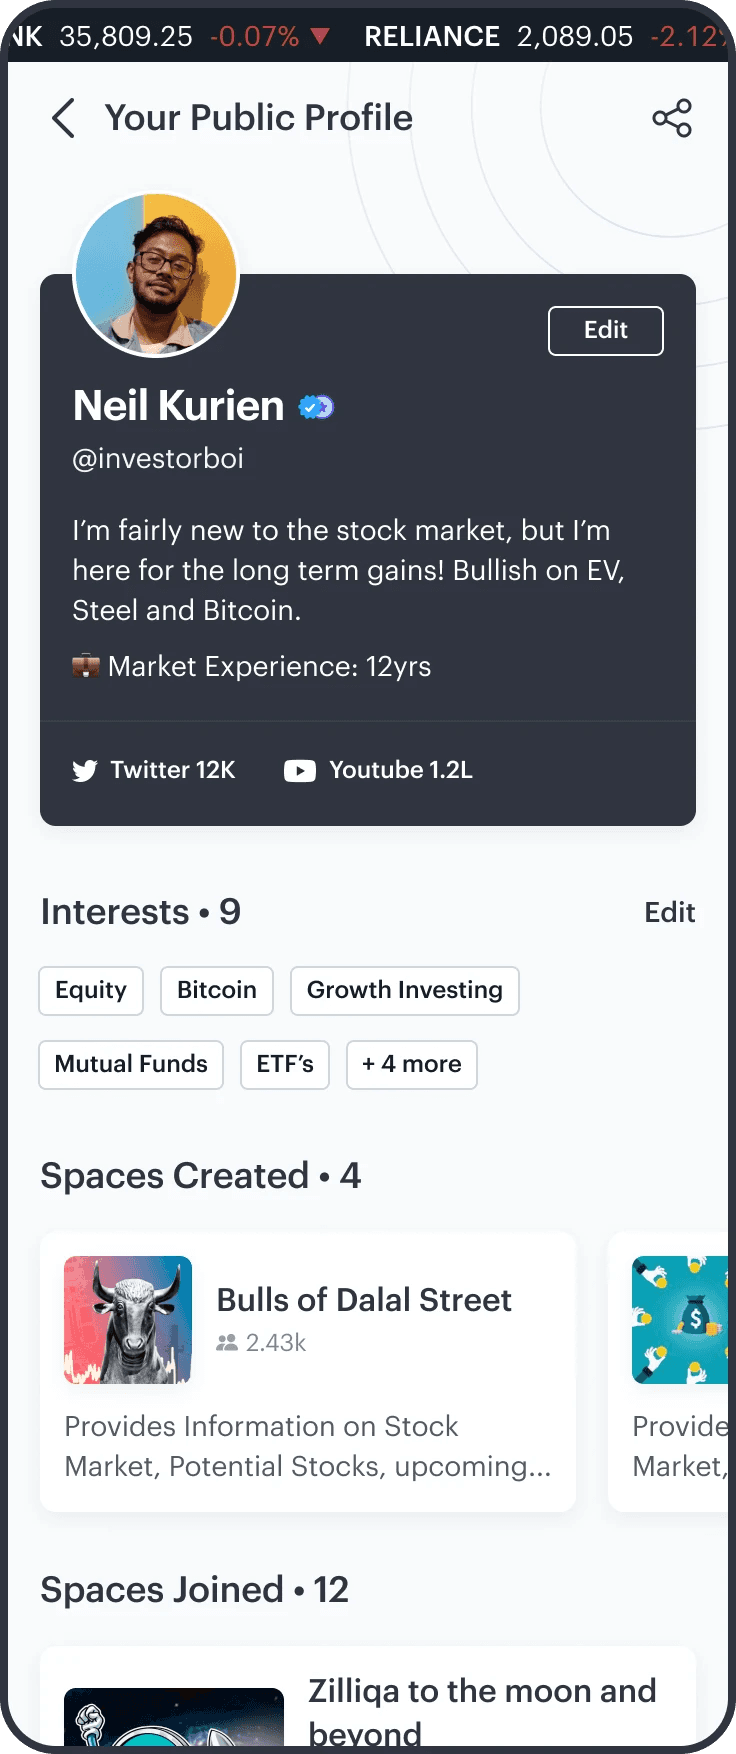
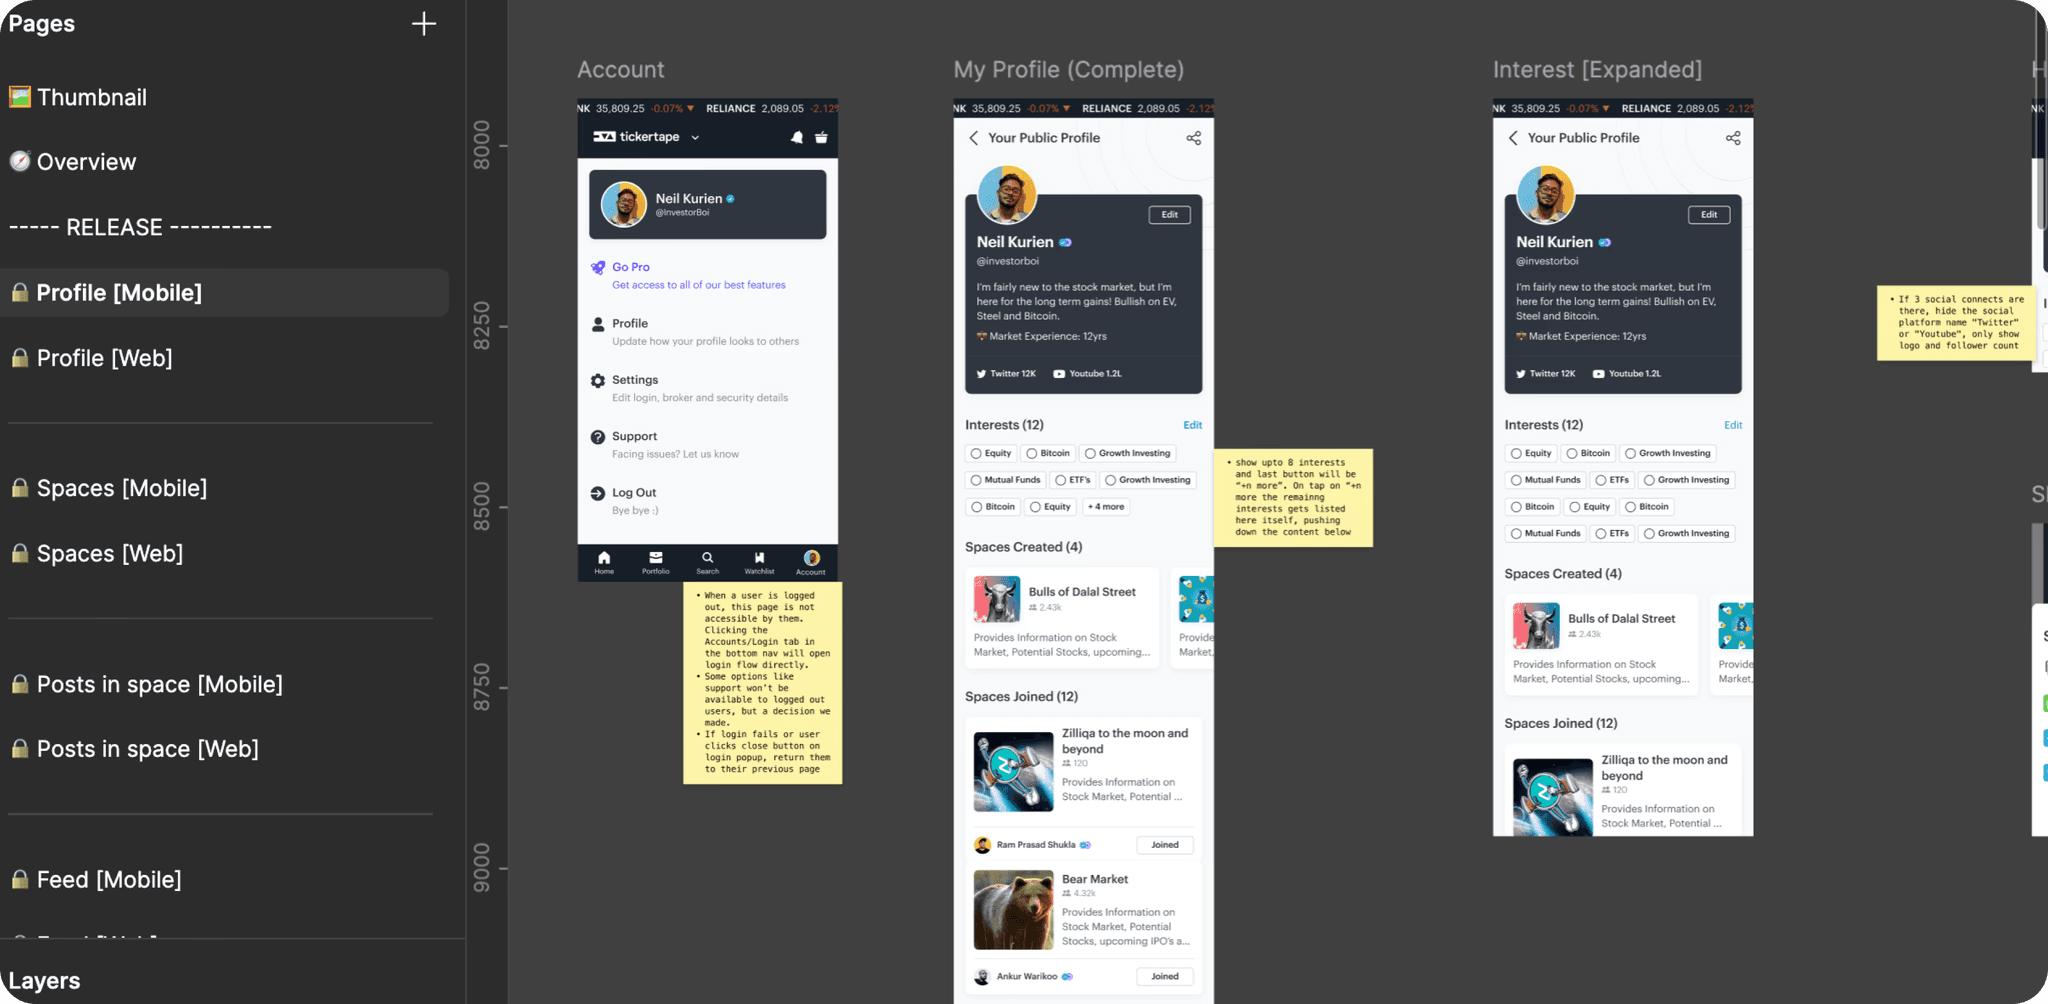
A revamped profile page that showcases a lot more than just a profile pic and a name
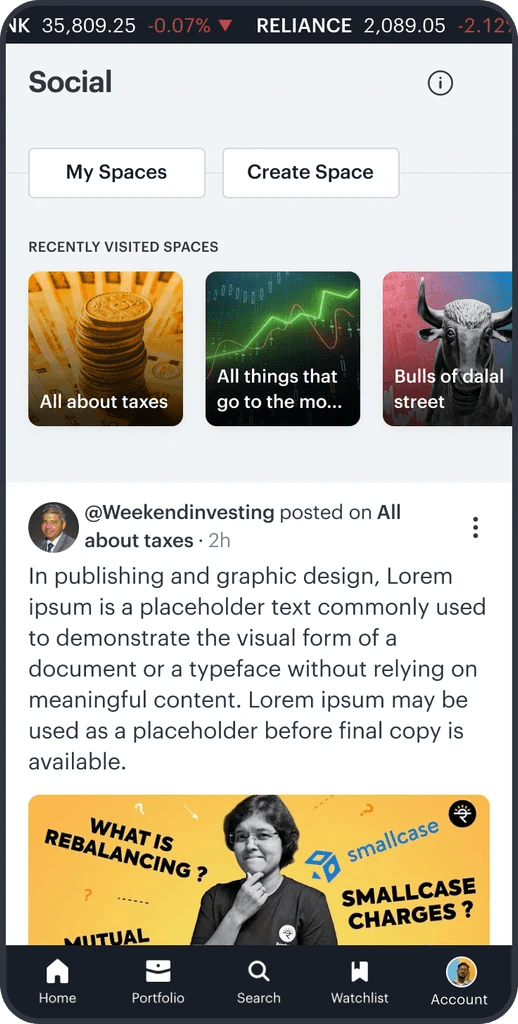
A brand new Feed to keep track of and discover top posts from users favourite influencers

Widgets to create engaging data visualisations
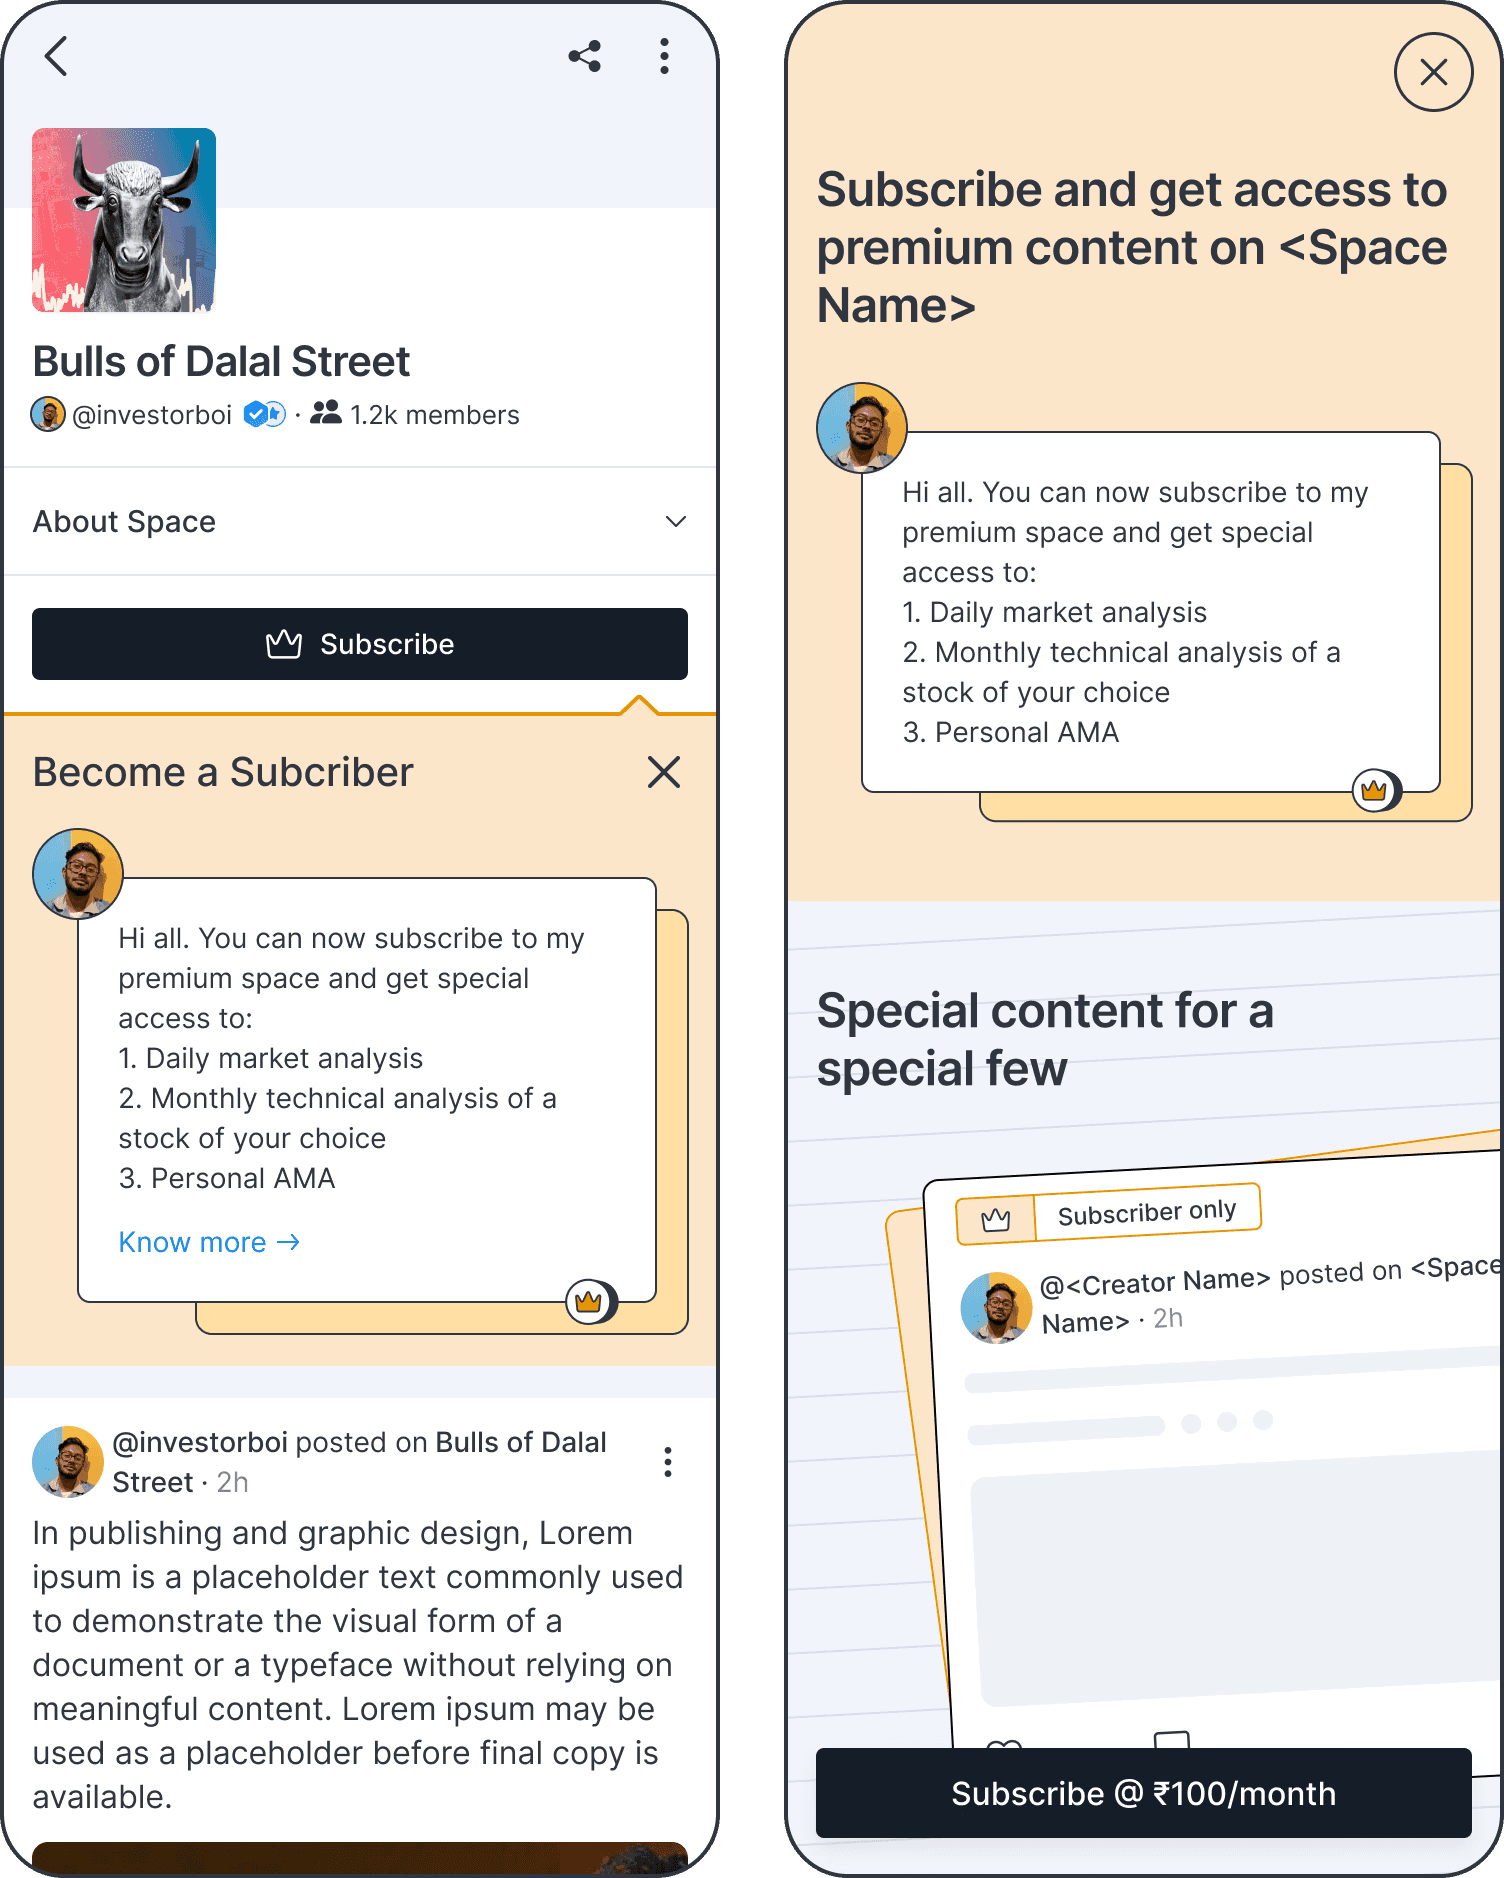
Premium Subscription Models for Exclusive Content
What were the opportunities..
Opportunity 1: Creating a Dedicated Financial Discussion Platform
Investors lacked a dedicated space to discuss financial markets, forcing them to rely on fragmented and inefficient methods, such as:
Sharing screenshots of financial data.
Manually creating charts to illustrate insights.
Using general social media, which is filled with distractions and irrelevant content.

No way to verify if the legitimacy of the data shared, leading to potential misinformation.

By integrating a social layer into Tickertape, we had the opportunity to provide a structured and credible platform for meaningful financial discussions.
Opportunity 2: Empowering Financial Influencers
Financial influencers struggled to reach their target audience due to the overwhelming presence of non-financial content on mainstream social media platforms. By offering a platform tailored for financial discussions, we could:
Provide influencers with direct access to an audience interested in finance.
Enable them to create engaging and interactive content using financial data widgets.
Help them build credibility and monetization opportunities within a focused community.
Opportunity 3: Enhancing Retail Investor Experience
Retail investors faced multiple barriers that hindered their participation in financial discussions and decision-making. By addressing these gaps, we saw opportunities to:
Improve access to trustworthy financial insights by curating high-quality content.
Simplify investment discovery through structured discussions and expert insights.
Enable direct engagement with financial experts, making investing more approachable.
Foster a welcoming community where new investors could ask questions without fear of judgment.
Opportunity 4: Business Opportunities
Beyond enhancing user engagement, Tickertape Social presented significant business opportunities:

Increased User Engagement & Retention: A social component encourages users to spend more time on the platform, leading to higher retention rates.
Ad Revenue & Sponsored Content: Financial institutions and brands could advertise and sponsor content to reach a highly engaged, finance-focused audience.
Premium Subscription Models: Exclusive groups, expert-led discussions, and premium content could drive additional revenue through memberships.
Affiliate & Partnership Opportunities: Partnerships with brokerages, investment platforms, and financial services could create new monetization avenues.
Key Questions & Decisions
1. Should Social be part of Tickertape or a standalone app?
Based on multiple stakeholder meetings, I decided to integrate it within Tickertape for the following reasons:
Tickertape already had 6M+ users.
A standalone app would require user re-education and re-acquisition.
Users prefer fewer apps on their devices.
2. Defining Community Features
To establish a well-structured financial discussion platform, I began by identifying the most effective ways to enable CRUD (Create, Read, Update, Delete) operations. This approach allowed me to prioritize the core features essential for a seamless user experience, including:
Profile pages for influencers and users
Groups for financial discussions
Widgets to enhance financial content creation
Home & Feed for curated and user-generated content
Edit the vlog episodes to create engaging and cohesive narratives, adding background music and soundscapes.
Incorporate eye-catching visual effects and transitions to maintain viewer engagement.
Optimize video length and format for various social media platforms and YouTube.
3. Creating an Information Architecture for Social Integration
Integrating social features into Tickertape’s existing ecosystem required a well-structured information architecture (IA)to ensure a seamless user experience. Key considerations included:
Where does Social fit in? Should it be a separate tab, or should social discussions appear contextually across the platform?
How does it interact with other features? Ensuring that financial discussions complement, rather than disrupt, the existing experience of stock screening and portfolio management.
Navigation and Discoverability: Making Social easily accessible while maintaining a familiar structure for existing users.
User Flows: Designing intuitive paths for users to transition from financial tools to social discussions and back.
4. How to Differentiate from Existing Platforms?
Asset Tagging: A unique feature allowing users to tag financial instruments like stocks in posts, providing relevant real-time data.
Market Data Widgets: Tools enabling users to create interactive posts using real-time financial data.
No Clutter & Distractions: Unlike mainstream social platforms where finance content competes with viral trends, Tickertape Social is dedicated exclusively to investing, making it a distraction-free space for meaningful discussions.
Platform-Verified Data: All visualizations are generated using data directly from Tickertape, ensuring accuracy and legitimacy. Since the data is sourced and created within Tickertape, users can trust that the information is 100% reliable.
Research
Secondary research

Studied research papers on social media behavior to understand what drives engagement, participation, and retention in online communities.
Analyzed successful and failed social media products, studying factors that led to the rise of platforms like Twitter and Reddit and what caused the decline of others like Google+ and Clubhouse.
Interviews
Like mentioned earlier, Tickertape Social was an experimental project initially conceived by the CEO based on certain hypothesis he had. To get started, I had in-depth conversations with both the CEO and the PM to understand their vision for the project. I then conducted online interviews with 3 fintech influencers and 4 existing Tickertape users to gain insights into their needs and expectations and how did those align to that of the CEO's vision.
CEO & PM 3 Financial Content Creators 4 Tickertape Users
Design
Information Architecture & Structural Planning
Developed an IA blueprint to ensure social features fit within Tickertape’s ecosystem.
Defined user flows for smooth navigation between social interactions and core financial tools.
Ensured discoverability of social discussions while maintaining Tickertape’s existing structure.
Wireframing and iterative design
I created multiple iterations, tested them with users, and reviewed them with stakeholders. Below are a few such iterations for some key features
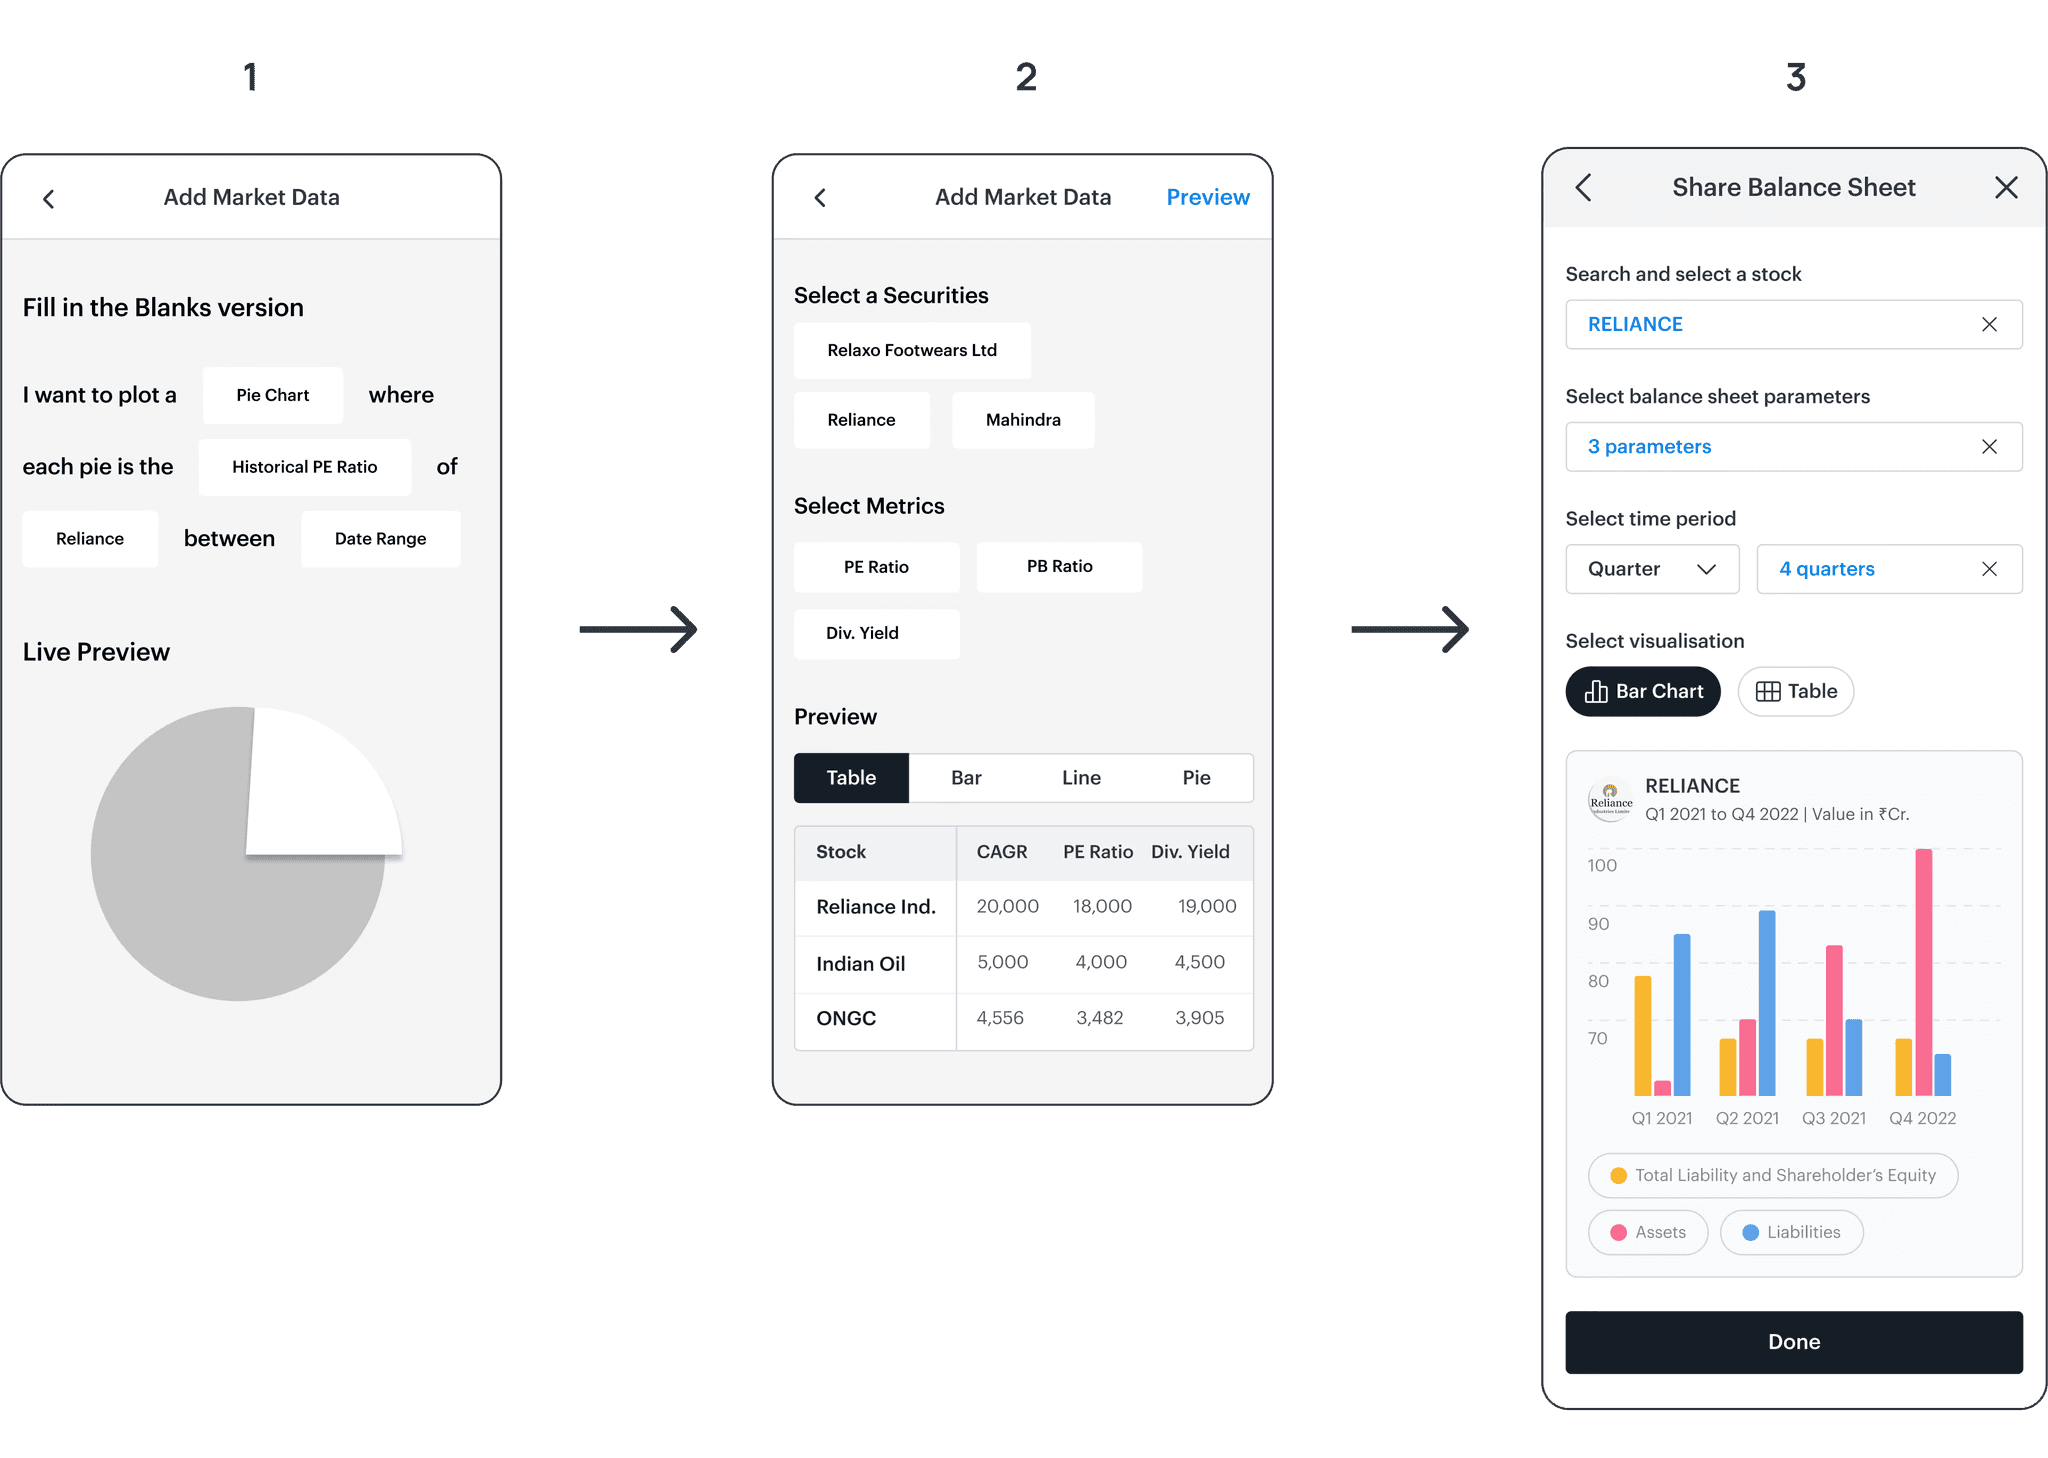
Market data widget
Iteration 1: Used a fill-in-the-blanks structure that progressively disclosed information as users filled in inputs. However, testing revealed that this approach was unpredictable due to numerous permutations and combinations.
Iteration 2: Improved predictability but introduced a new challenge. After speaking with a financial expert, I realized that "each data point has an ideal visual representation—some are best as bar graphs, others as trend lines." This version placed the burden on users to determine the best way to represent their data.
Final iteration: Both previous versions required time and financial knowledge to select appropriate chart types. However, Social was a new platform, and users were still familiarizing themselves with it. To simplify the experience, I templatized the process, making it easier to create engaging content. I collaborated with financial experts to determine the best chart types for various data points, ensuring an intuitive and seamless user experience.
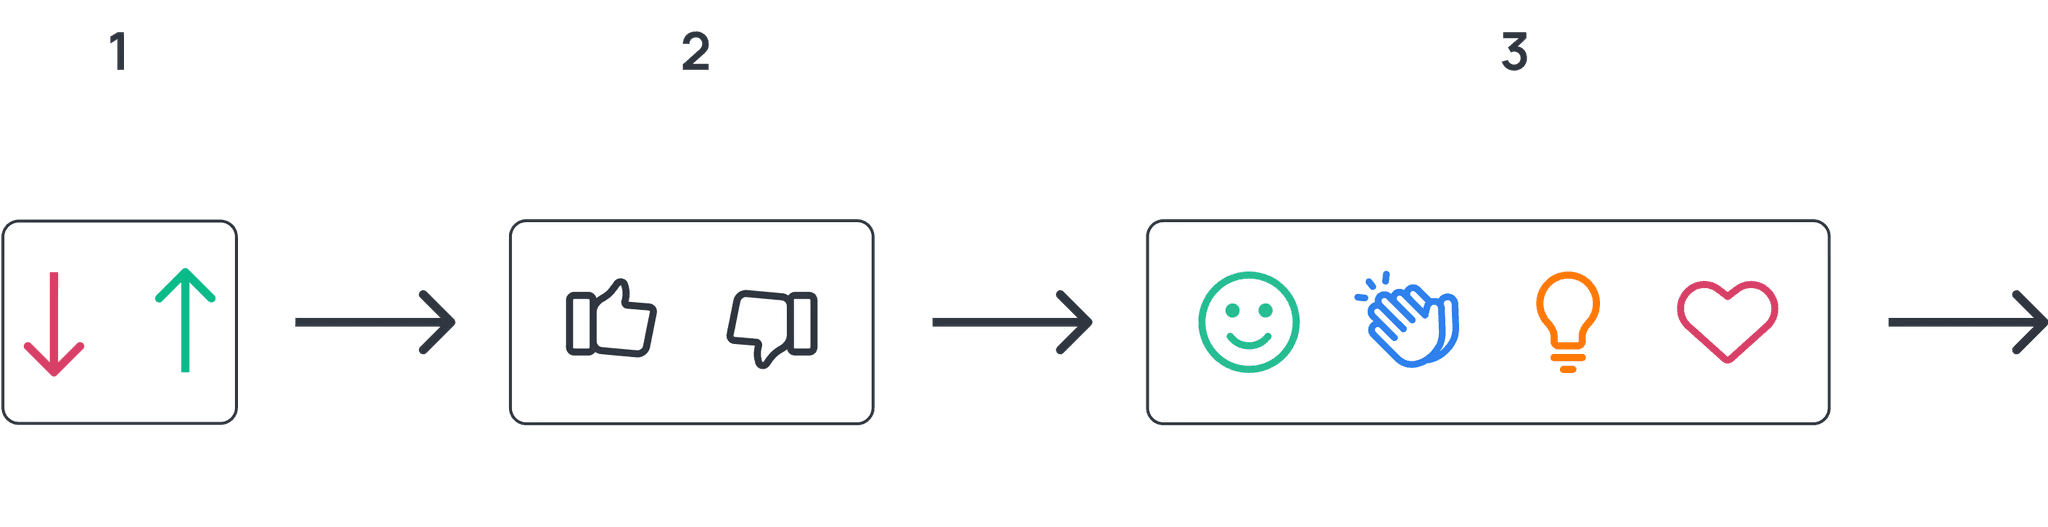
Reaction mechanism
Iteration 1: Upvote/downvote systems introduce polarization—users must decide if something is “good” or “bad,” which can discourage participation.
Iteration 2: Thumbs up/down still require evaluative judgment, making users think twice before engaging. Dislikes can discourage creators and lead to toxic interactions.
Iteration 3: Offering multiple reactions (smiley, clap, bulb, heart) might provide more nuance, but it also complicates the decision-making process. Too many choices can lead to decision fatigue, making users less likely to engage at all.
Final iteration: A single heart icon encourage engagement, and avoid decision fatigue or potential discouragement from negative reactions.
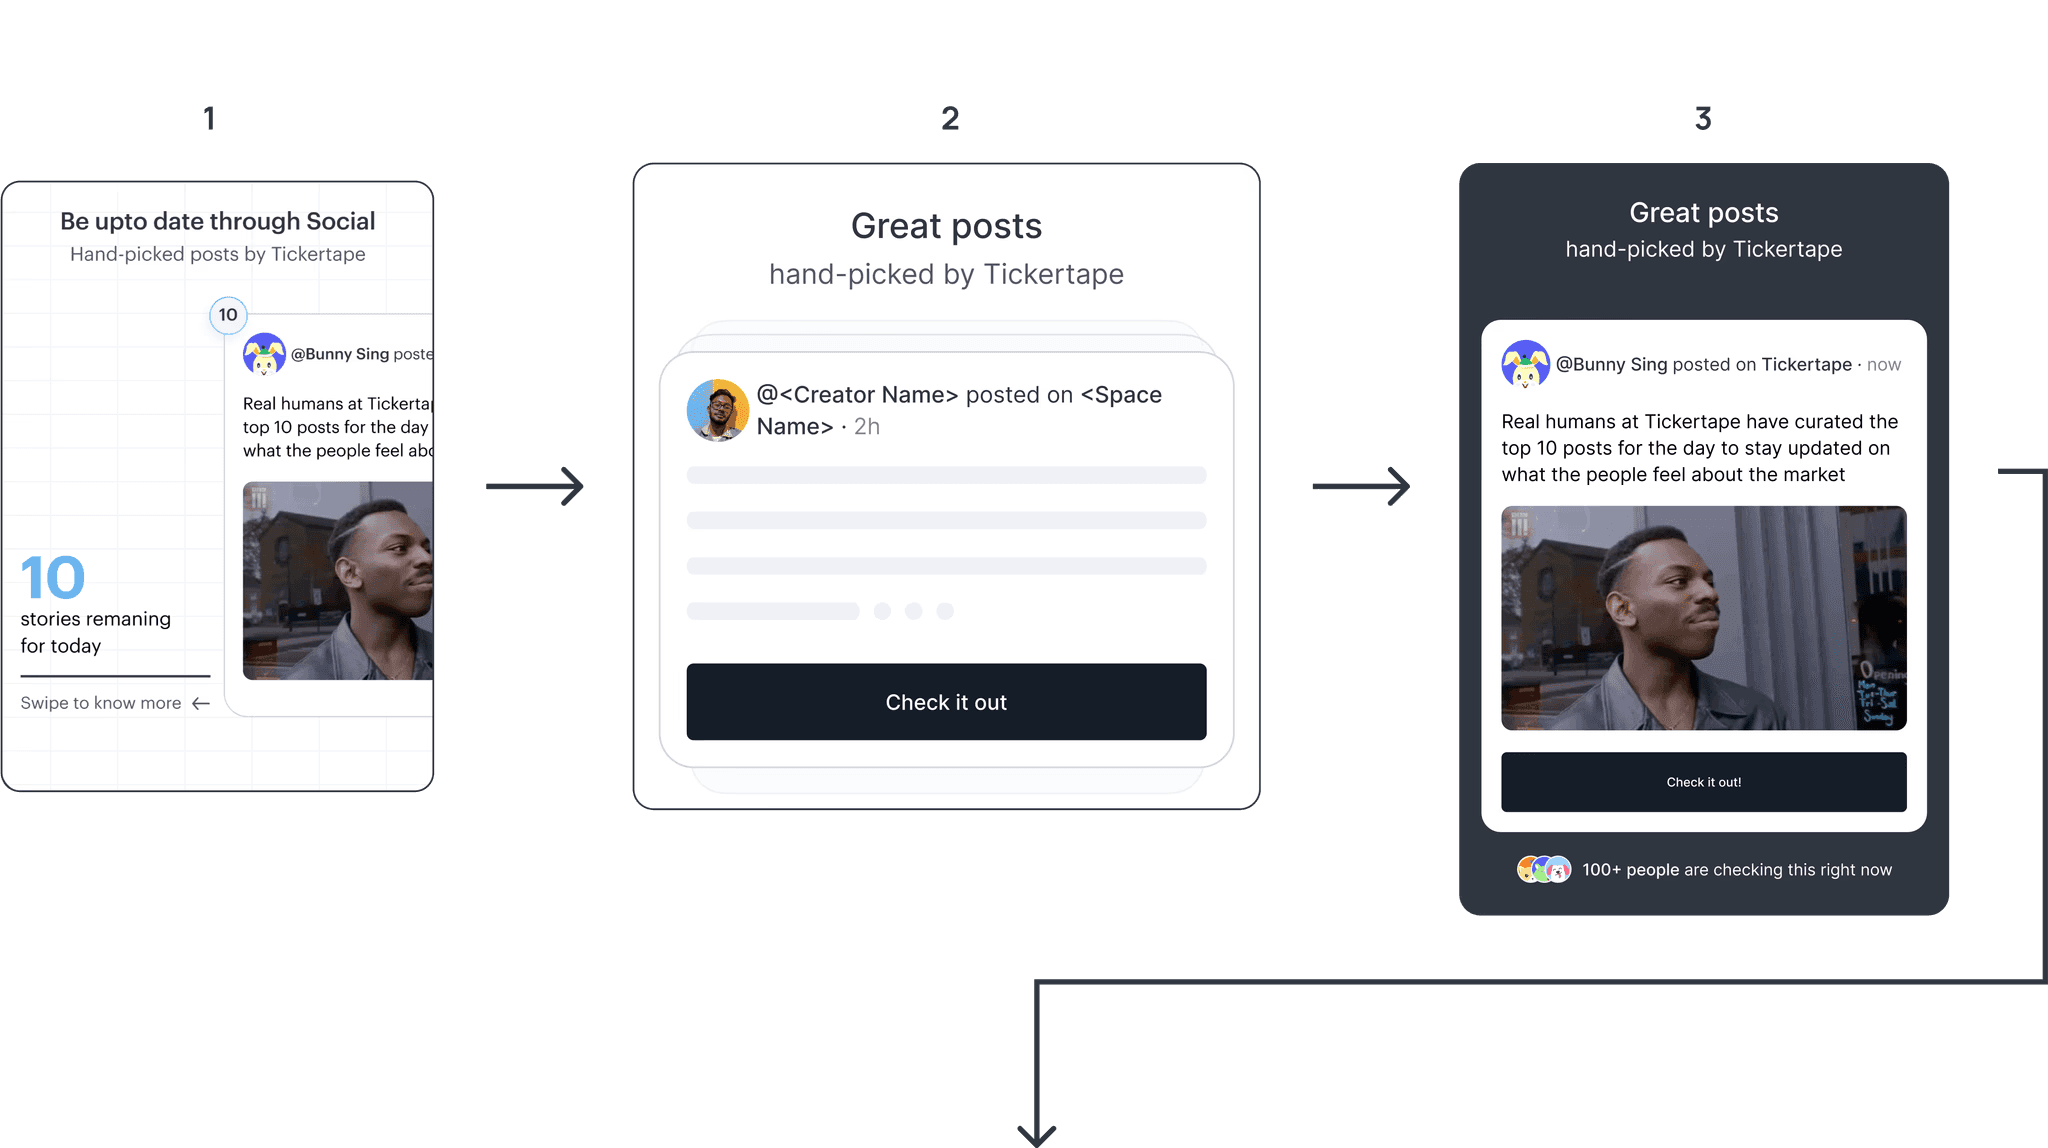
Social cards for Content discovery :
After launch, I noticed that some users weren’t discovering or engaging with Social. To solve this, I explored leveraging the Tickertape homepage by highlighting the top 5-10 best-performing posts.
Iteration 1: I added the posts into cards and put them into a horizontal scroll. But large post previews caused the homepage height to constantly adjust, creating an inconsistent experience.
Iteration 2: A static version with a CTA redirecting users to a modal state. However, users found these cards too similar to loading states.
Iteration 3: An upgraded version of the second iteration with actual posts to prevent it from looking like a loading state.
Iteration 4: A focused modal state on tapping the CTA, but users expected a swipe interaction. I had to determine whether "Check it out" should open the already viewed post or the next one. This feature ultimately improved discovery of top-performing posts and spaces while engaging new users who hadn’t interacted with Social before.
Outcome
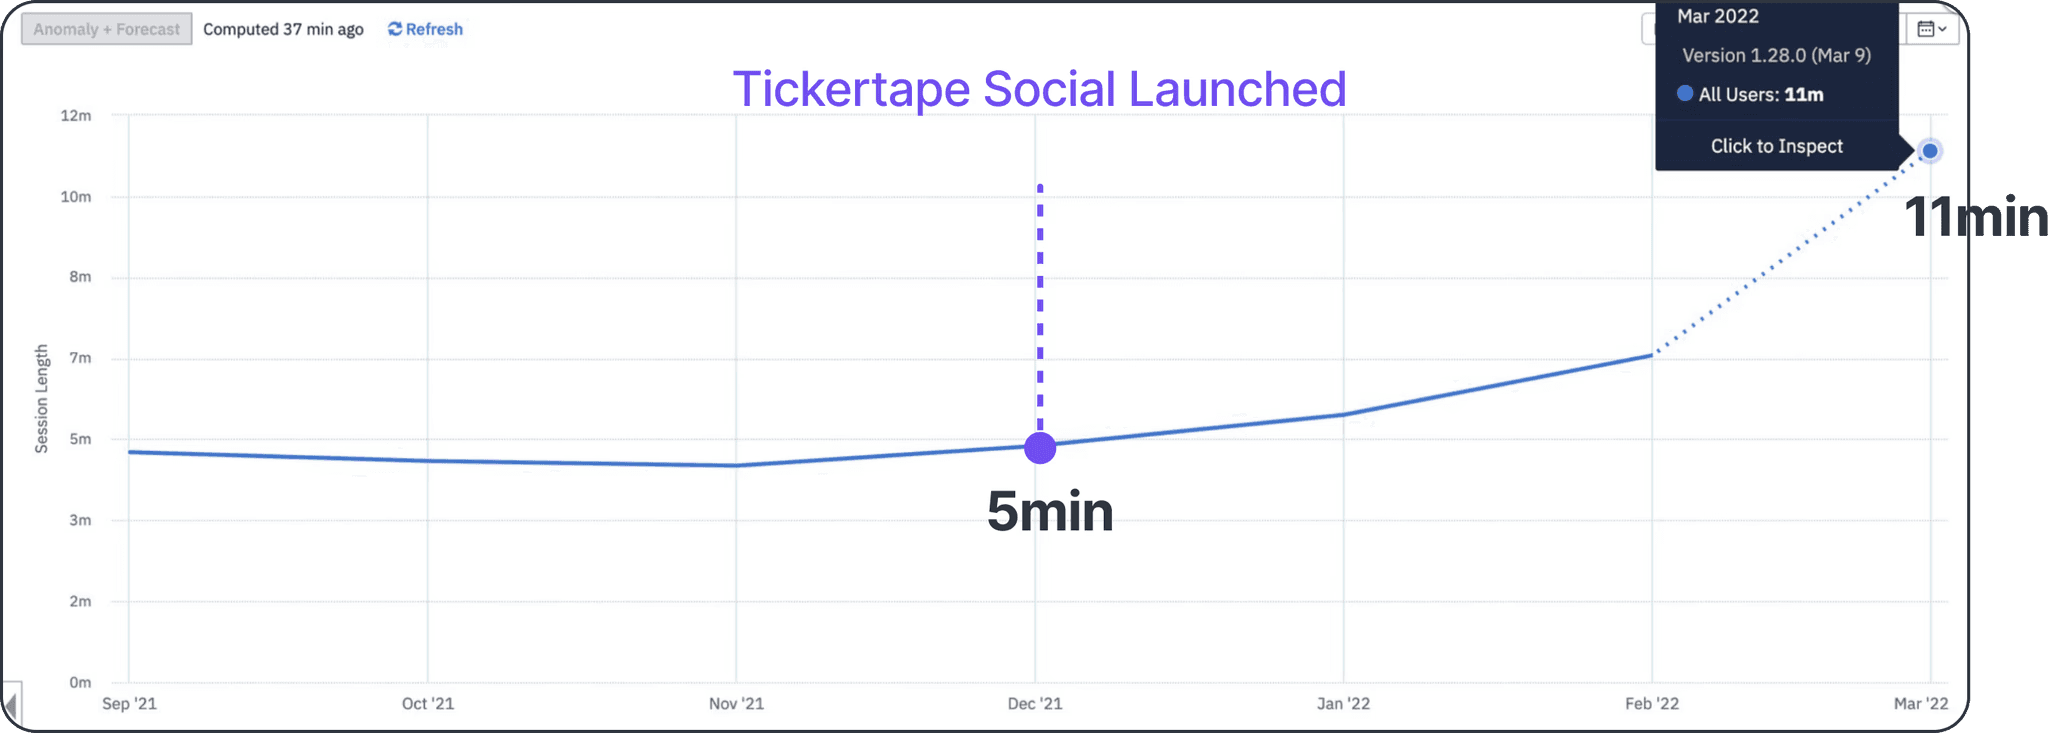
🏆 Outcome 1: Average session length on Tickertape went from 5 minutes to 11 minutes, which is a 120% increase, within three months after the launch of Social
🏆 Outcome 2: Assets added to watchlist on daily basis went up by 22%.
🏆 Outcome 3: Drove up monthly transaction by 10%
Reflection
1. Interaction documents are not contextual or fun to read for developers
I noticed that my developers sometimes missed specific design details even though they were included in the interaction document. Initially, I used a wordy Google Doc to document interactions across features, but I realized it was too long and tedious to read and talking to them they too . This led me to introduce a new practice: attaching yellow sticky notes next to the designs in Figma to provide specific instructions for developers, such as edge cases, use cases, and sample interactions. They loved this approach because it offered contextual guidance, and being a small and agile team, this helped us move faster. It also allowed us to maintain a single source of truth within Figma.
Great product at the wrong time
Social was initially designed to boost engagement, not generate revenue. We succeeded in that goal, as reflected by a 120% increase in average session length. However, like many businesses, Tickertape was also impacted by COVID. While user growth was a priority, the business had to focus on revenue due to limited funding. Social media, requiring more time and capital, was deprioritized in favor of revenue-generating tools.